第1737题:The slopes of tangent lines

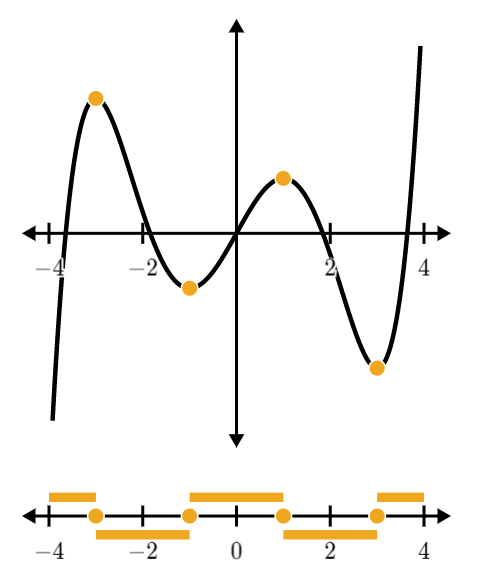
Which one of the three graphs below represents the derivative of the function graphed above?
A.

B.

C.

Tip:
A strategy for predicting what the derivative of a function will look like is to keep track of these moments on a number line.
The highlights above the number line represent when the slope is positive, the dots on the number line represent when the slope is zero, and the highlights below the number line represent when the slope is negative.

From brilliant.org


